News
2026-02-12

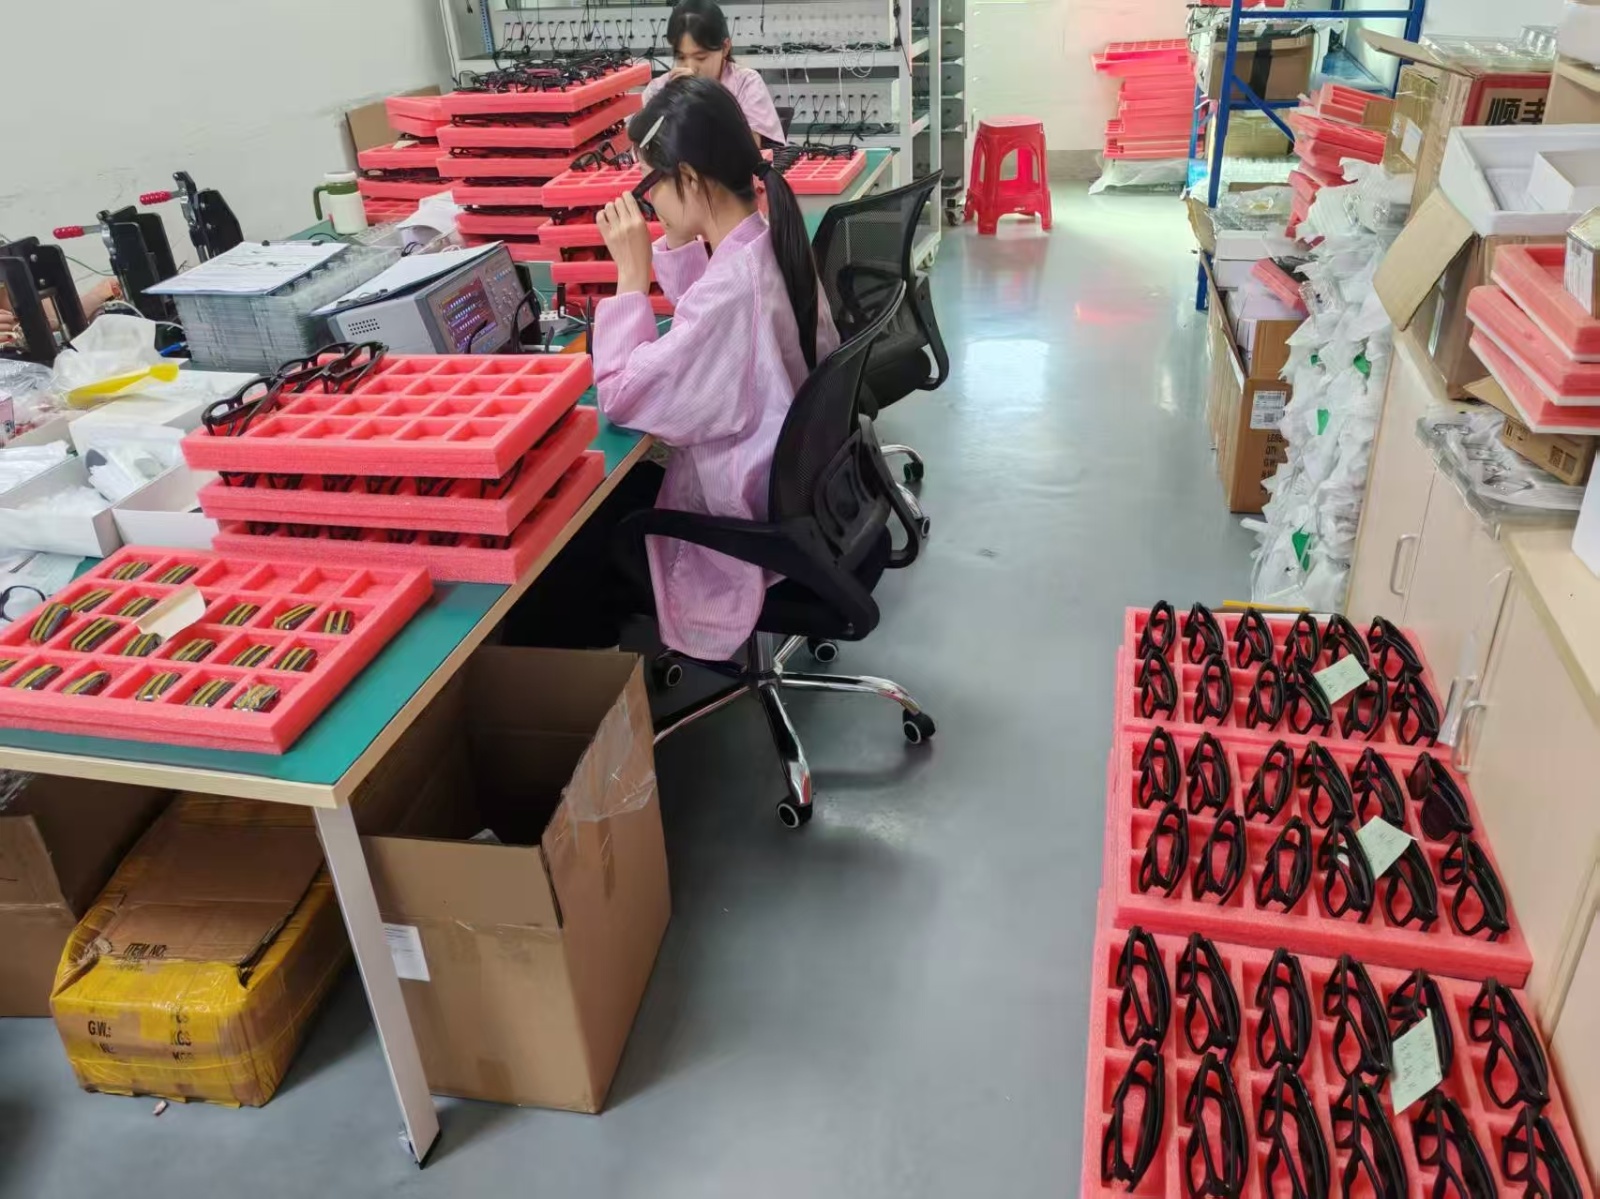
Global demand for wrist and ear wearables is growing rapidly. U.S. buyers now face concentrated production in Asia, stressing margins and delivery. China smart wearable factories remain central to sourcing strategies; buyers must evaluate capacity, utilization, and unit economics before committing.
| Metric | Small Boutique House | Medium EMS Partner | Large ODM/Tier 1 |
|---|---|---|---|
| Monthly Capacity | < 50k units | 50k - 200k units | 500k+ units |
| Cost Efficiency | Low (High BOM) | Moderate | High (Volume discounts) |
| Lead Time (MP) | 6-8 Weeks | 8-12 Weeks | 12-16+ Weeks |
| Ideal For | Niche Smart Glasses | Fitness Bands | Flagship Smartwatches |
China’s ecosystem includes ODM/fabless partners, EMS/contract manufacturers, and specialized assembly houses. Proximity to PCB fabs, battery makers, and optical module vendors shortens component transit and validation loops. This high supplier density materially reduces iteration time for prototypes and lowers logistics overhead.
Request concrete capacity metrics: units/month by SKU, active lines, and shifts per day. Common bottlenecks often include PMIC allocation, OLED availability, and sensor lead times. Contract buffers should specify committed vs. flexible capacity to avoid cuts during the pre-holiday workforce slowdown.
Unit cost divides into BOM, NRE (tooling, molds), labor, and compliance. Negotiation levers include MOQs and shared NRE amortization. For example, moving from a 10k unit run to a 100k run can unlock significant component discounts, often halving the NRE impact per unit.
Dr. Marcus Wei
Senior Manufacturing Consultant, WearableTech Global
"When reviewing PCB layout, insist on HDI (High-Density Interconnect) design reviews early. Many factories optimize for speed over thermal management. For smartwatches, a 0.5mm shift in heat-sink placement can extend battery life by 8% under GPS load."
Troubleshooting Tip:
Always verify the input voltage margin for the battery protection circuit. We often see failures in field testing because of inadequate decoupling capacitor placement near the PMIC.
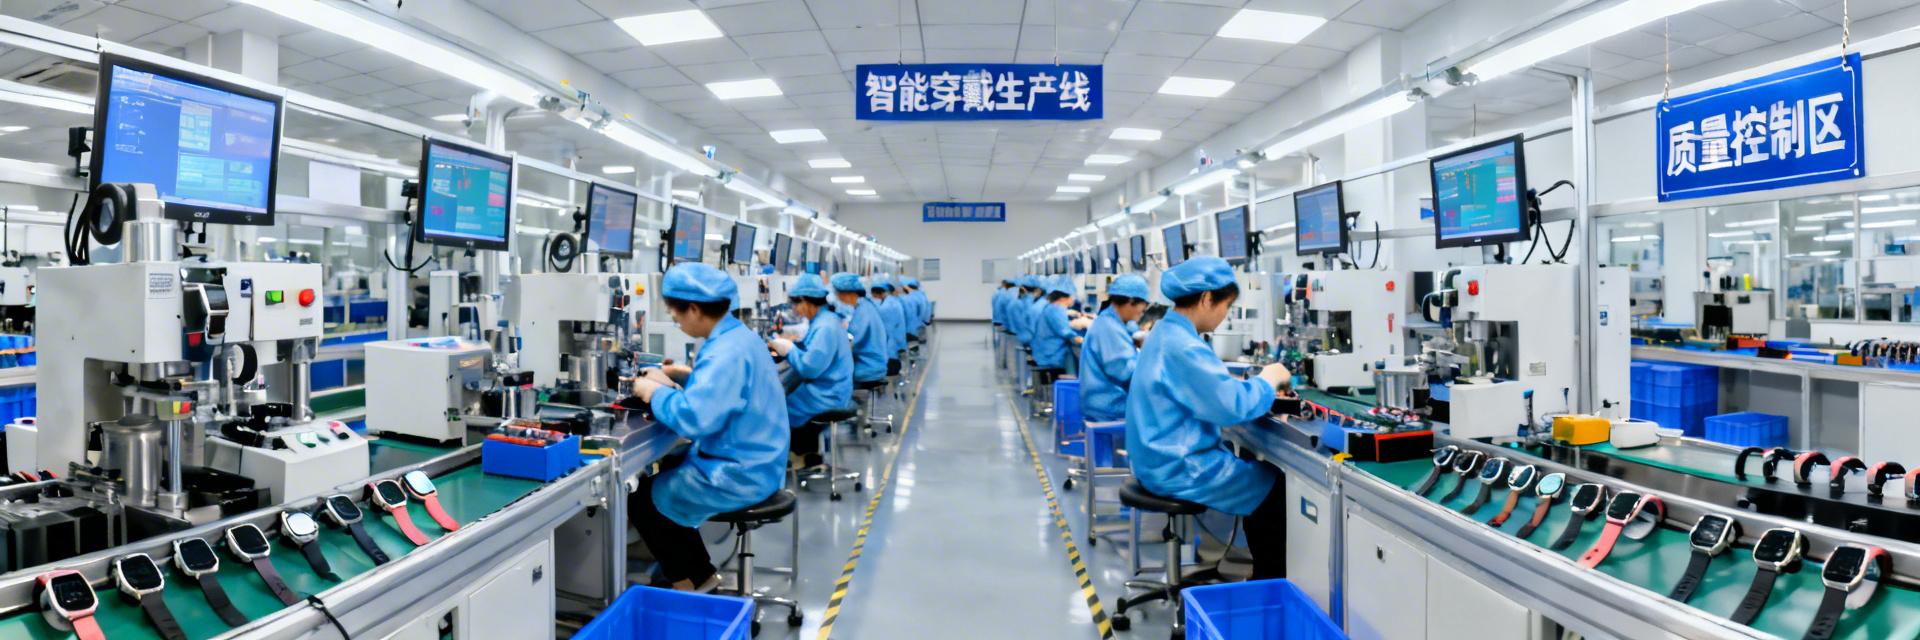
Projects follow standard milestones: sampling (2–6 weeks), NPI validation (4–12 weeks), and mass production (6–16+ weeks). Startups face higher per-unit costs and longer lead times, while established brands leverage volume for reserved capacity.
High-volume consumer devices require high-speed SMT lines and automated testing jigs to maintain margin.
Hand-drawn diagram for illustrative purposes only, not a precise engineering schematic. (手绘示意,非精确原理图)
Demand RFPs with detailed capacity, yield, and factory audits. Include contract clauses for reserved capacity and penalties for missed critical-path milestones. Maintain a second-source strategy to balance cost and risk.
Q: How should US buyers assess factory capacity?
A: Request historical production logs and SKU-specific yield rates. Transparent factories will provide BOM lead-time maps to prove their scalability.
Q: What are the primary cost drivers?
A: Displays (OLED/AMOLED), SoCs, and high-energy-density batteries. Testing and NRE represent the largest fixed overhead costs.
Q: How long is the transition from sampling to mass production?
A: Generally 3 to 5 months. This includes NPI (New Product Introduction) cycles, certification testing (CE/FCC), and supply chain ramp-up.


{{ boxName }} ({{ dataList?.length || 0 }} Items)
{{ val.manufacturer || val.en_manufacturer || '' }}
auto.lang_Quantity: {{ val.quantity }}
auto.lang_null