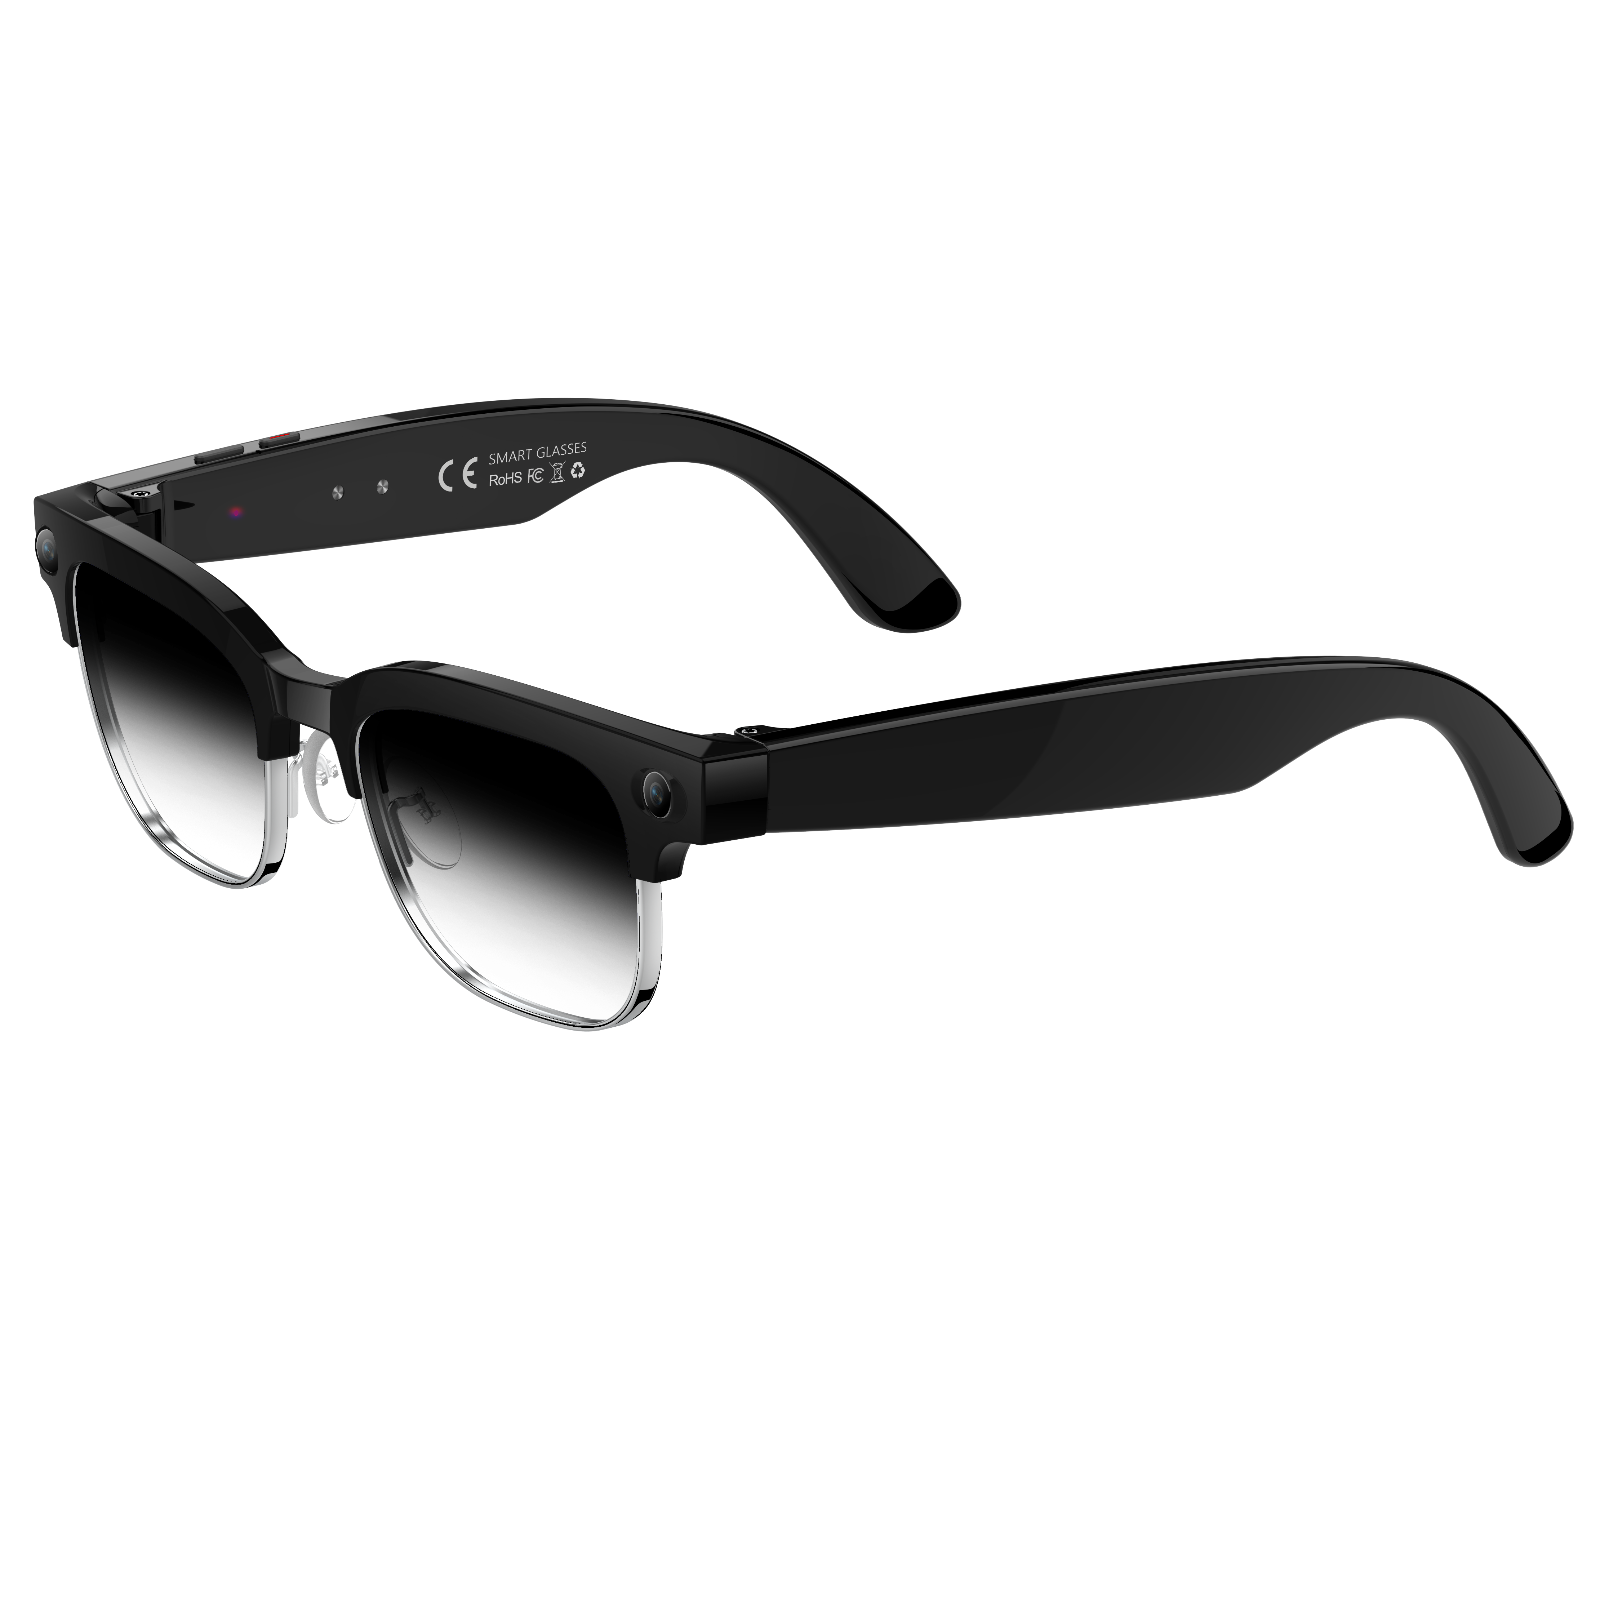
Smart Glasses Noise-Cancellation: Market Data & Key Insights
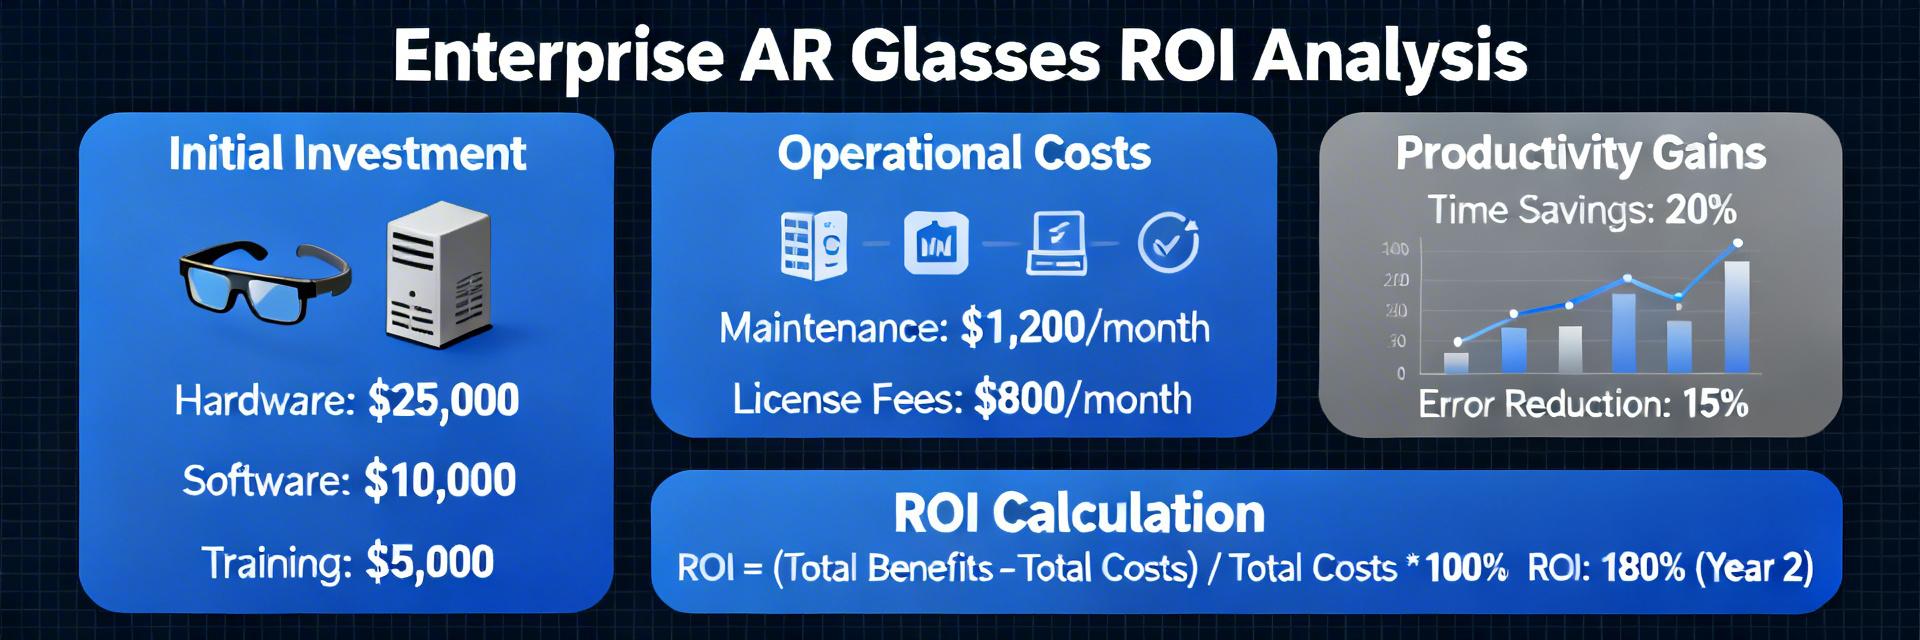
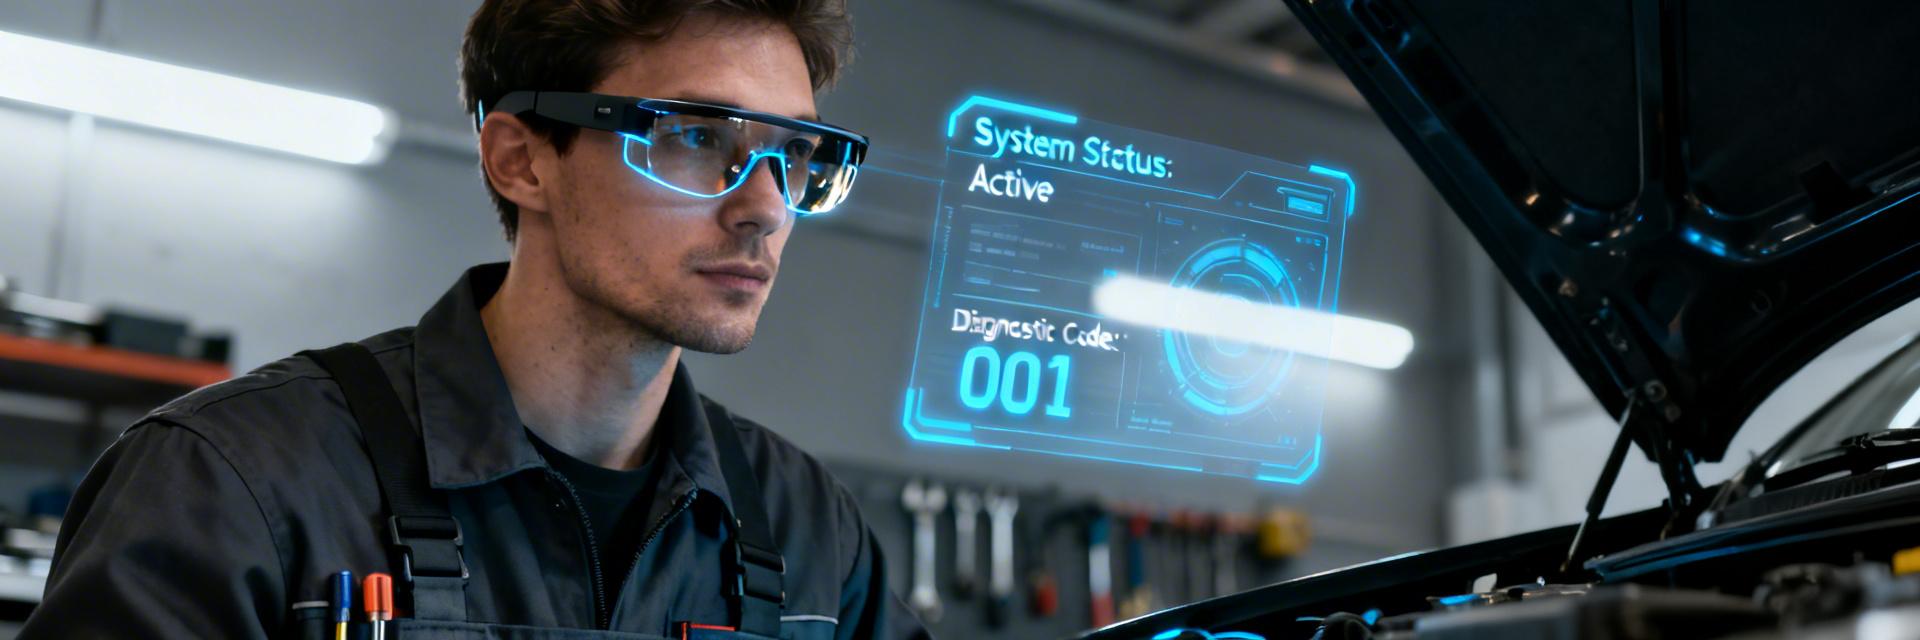
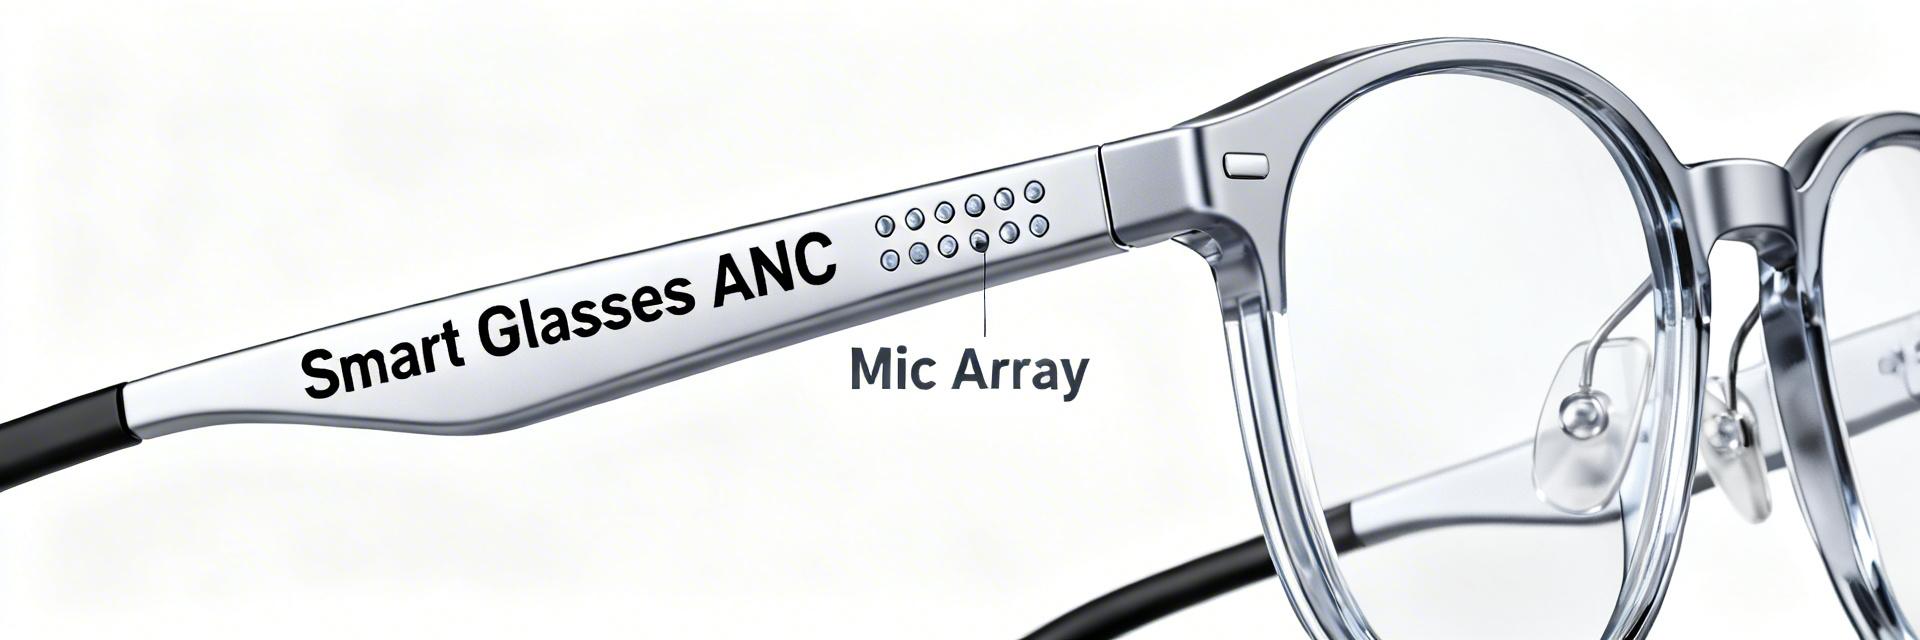
🚀 Key Takeaways Market shifting from millions to a multibillion-dollar US ecosystem. High double-digit CAGR driven by enterprise and consumer audio convergence. Noise cancellation (ANC) is the primary driver for premium ASP and hardware margins. On-device DSP and beamforming are critical technical differentiators for 2024-2025. Smart Glasses Noise-Cancellation: Market Data & Key Insights Strategic Insight: Smart wearable audio is scaling rapidly and integrated audio is now a key differentiator. Recent industry reports estimate US smart glasses revenue expanding from current low hundreds of millions toward multibillion-dollar markets with high double‑digit CAGR; shipments are rising as consumer and enterprise demand converges. These market data signal product managers should prioritize audio features—particularly noise cancellation—when planning roadmaps for smart glasses with noise cancellation. Market overview: current size, growth drivers Visualizing the trajectory of the smart audio eyewear market. Market size & near-term forecasts The market is nascent but growing. Aggregate forecasts from multiple market research summaries indicate global revenue growth outpacing unit shipment growth, with US adoption accelerating driven by wearable audio use-cases and enterprise procurement. This divergence raises Average Selling Prices (ASPs) and justifies investment in premium audio, as noise-enabled feature sets shift the value proposition for smart glasses. Key demand drivers in the US Demand is multi‑factorial. Drivers include broader wearables adoption, remote collaboration needs, enterprise hands-free workflows, and healthcare assistive listening trends reported in consumer and B2B surveys. Each driver maps to noise cancellation implications—privacy and compliance for enterprise, speech clarity for remote work, and improved assistive hearing in healthcare procurement. Technology Comparison: Standard vs. Premium ANC Smart Glasses Feature Standard Audio Glasses Premium ANC Smart Glasses User Benefit Noise Reduction Passive Only (0dB) Active 25dB - 35dB 90% reduction in background hum Mic Array Single/Dual Mic 4-6 Mic Beamforming Crystal clear calls in wind/traffic Battery Impact High (unoptimized) Low-power dedicated DSP +20% extra talk time per charge PCB Footprint Bulky SiP / Highly Integrated Lighter frames, better ergonomics Market data deep-dive: segments & unit economics Segmentation by use case & price tier Market segments show distinct feature expectations. Consumer audio eyewear, AR-lite devices, enterprise/industrial units, and healthcare/assistive products each command different price bands and growth rates per market data. Price tiers correlate with ANC, beamforming microphone arrays, and battery capacity; product teams should map segment share to feature investment for smart glasses with noise cancellation. Unit economics & channel margins Noise-cancellation modules materially affect BOM and margins. Typical cost drivers are microphones, DSP licensing, ANC algorithm development, and battery capacity, with OEM BOM uplift concentrated in audio subsystems. Expected MSRP ranges expand with audio premium tiers, enabling higher OEM and channel margins if supported by bundled services or enterprise licensing. JT Engineer's Perspective: Technical Deep-Dive By Julian Thorne, Senior Audio Systems Lead "The biggest pitfall in smart glasses ANC is loopback latency. If your DSP isn't processing environmental noise in under 10ms, the user experiences a 'comb-filtering' effect that causes nausea. For PCB layouts, I strongly recommend keeping the decoupling capacitors as close to the DSP power pins as possible to avoid switching noise bleeding into the high-gain microphone pre-amps." Selection Advice: Always leave 20% voltage margin on your input rails for transient peaks during ANC engagement. Prioritize MEMS microphones with a Signal-to-Noise Ratio (SNR) of at least 65dB for industrial environments. Noise-cancellation technology landscape ANC architectures & audio capture techniques Multiple architectures compete for mobile form factors. Active noise cancellation, adaptive beamforming, ambient-aware playback, microphone arrays, and bone-conduction alternatives each show different maturity and power profiles. Trade-offs—power, latency, and form factor—determine whether noise cancellation is best delivered on-device via low‑power DSP or augmented by cloud processing for heavier models. Performance metrics & testing methodology Consistent KPIs enable comparison and procurement. Recommended metrics include SNR improvement, speech intelligibility index, ANC attenuation curves, algorithmic latency, and measured battery impact under repeatable scenarios. A reproducible checklist—crowded office, transit, and open‑air tests—lets teams validate claims and translate benchmark outcomes into procurement and marketing language. Typical Application: Enterprise Remote Support In high-noise industrial environments, ANC smart glasses allow a technician to hear remote instructions clearly while 4-mic beamforming filters out 90% of heavy machinery noise for the remote expert. Hand-drawn schematic, not a precise circuit diagram Mic Array Integration DSP Processing Hub Use cases & vertical demand: who benefits most Consumer & prosumer scenarios Everyday behaviors shape preferred modes. Commuting, fitness, calls, and media consumption surveys show users favor ambient‑aware modes, seamless call handoffs, and unobtrusive form factors. Persona-driven design and willingness-to-pay insights suggest premium ANC and reliable microphone arrays drive conversion for commuter and prosumer buyers of smart glasses. Enterprise, healthcare & industrial applications Vertical buyers prioritize reliability and compliance. Enterprise use for hands‑free ops, assistive listening in healthcare, and noise‑sensitive industrial environments demand documented ROI and safety compliance. Procurement criteria should include uptime, failure rates, and measured speech clarity; effective noise cancellation can reduce training time and improve operational throughput. Product & market trends shaping competition Form factors, UX patterns & distribution trends Diverse form factors are emerging. Sunglasses, clear‑lens frames, discreet audio inserts, and full AR devices appear across retail and direct enterprise channels, with subscription firmware and OTA upgrades becoming common. A 2x2 positioning (feature richness vs. price) helps place offerings and supports comparison content such as best noise cancellation smart eyewear anchors for buyer journeys. Go-to-market & actionable recommendations Recommendations for product teams & R&D priorities Prioritize select audio investments. A focused checklist—sensor selection, on‑device DSP vs. cloud, battery optimization, ambient UX, and real-world testing—aligns with observed performance trade-offs. For an MVP, include robust beamforming mics, baseline ANC, ambient-aware UX, and KPIs such as adoption rate and measured SNR improvement. Recommendations for investors & procurement teams Due diligence must be audio‑focused. Validate market data, supply chain resilience, audio IP, and regulatory exposure. Track a 12–18 month roadmap with milestones on sales velocity and NPS. Investors should prioritize firms with defensible audio algorithms and proven real‑world benchmarks to reduce go‑to‑market risk. Summary Market Opportunity: Robust growth in smart glasses driven by audio demand; focus investments where market data shows high ASPs. Technical Bets: Prioritize on‑device DSP, efficient beamforming mic arrays, and battery optimizations. Go‑to‑Market Actions: Validate segment-specific KPIs and pilot subscription offers to measure ARPU. Frequently Asked Questions What market data supports investing in smart glasses with noise cancellation? Multiple industry reports show accelerating revenue growth. Consumer and enterprise segments value integrated audio, directly raising ASPs and justifying premium investments. How should teams measure noise cancellation performance? Measure SNR improvement, speech intelligibility, and ANC attenuation curves. Procurement teams should require lab reports plus controlled field trials (transit, office) before deployment. What are the fastest paths to market for enterprise buyers? Pilot high-impact workflows like remote supervision and hands-free operations. Use these pilots to verify noise cancellation benefits and refine ROI metrics before scaling.
Read More