News
2026-02-12

Industry forecasts estimate unit shipments of smart glasses reaching the low‑hundreds of millions by 2030, driven by slimmer AR use cases and audio‑first wearables. Market estimates show average BOM ranges clustered by tier:
Reduces device heat by 15%, extending active AR sessions without skin discomfort.
Equivalent to standard luxury eyewear; prevents nose bridge fatigue over 8+ hours.
Provides immersive "large screen" notifications without blocking peripheral safety vision.
Component price declines for key assemblies (displays, SoCs, batteries) are commonly modeled at single‑ to low‑double‑digit annual reductions as volumes scale, which shifts viability from niche pilots to mainstream devices. This data‑driven framing explains why smart glasses hardware economics now determine adoption speed and product strategy.
Smart glasses hardware encompasses the mechanical and electronic systems that enable wearable AR, audio, and sensing. Evidence: Typical scope includes frame and temples, optics/display subsystem (waveguides, micro‑OLED, LCoS, projection optics), SoC and mainboard, power (battery and charging), sensors (IMU, GNSS), cameras, microphones, speakers, antennas, and comfort/mechanical parts.
| Feature / Tier | Entry (Audio-First) | Midrange (HUD/Lite AR) | Premium (Full AR) |
|---|---|---|---|
| Typical BOM | $40 – $140 | $120 – $420 | $400 – $1,000+ |
| Display Tech | None / LED indicators | Monocular / LCoS | Binocular Waveguides |
| Battery Strategy | Single-cell (Temples) | Dual-cell Balance | High-Density / External |
| Cost Driver | Audio/Connectivity | Optics & Sensors | Waveguides & R&D |
"When designing for the $300-$500 price point, the biggest trap is over-specifying the SoC. For lightweight notifications, a mobile-class SoC is overkill and adds unnecessary heat. Pro Tip: Focus on 'distributed compute'—offload heavy SLAM processing to a tethered smartphone or cloud whenever latency allows. This allows for a 20% reduction in battery mass while maintaining frame integrity."
Use rigid-flex PCBs to navigate the hinges; ensure decoupling capacitors are placed within 1mm of the display driver to minimize EMI noise in optical waveguides.
Optics and display systems usually dominate premium BOMs. Options include waveguides with couplers, micro‑OLED panels, LCoS engines, or projection optics. Tooling for waveguides and precision coatings drive high NRE (Non-Recurring Engineering) and per‑unit pricing.
Hand-drawn schematic for conceptual reference only.
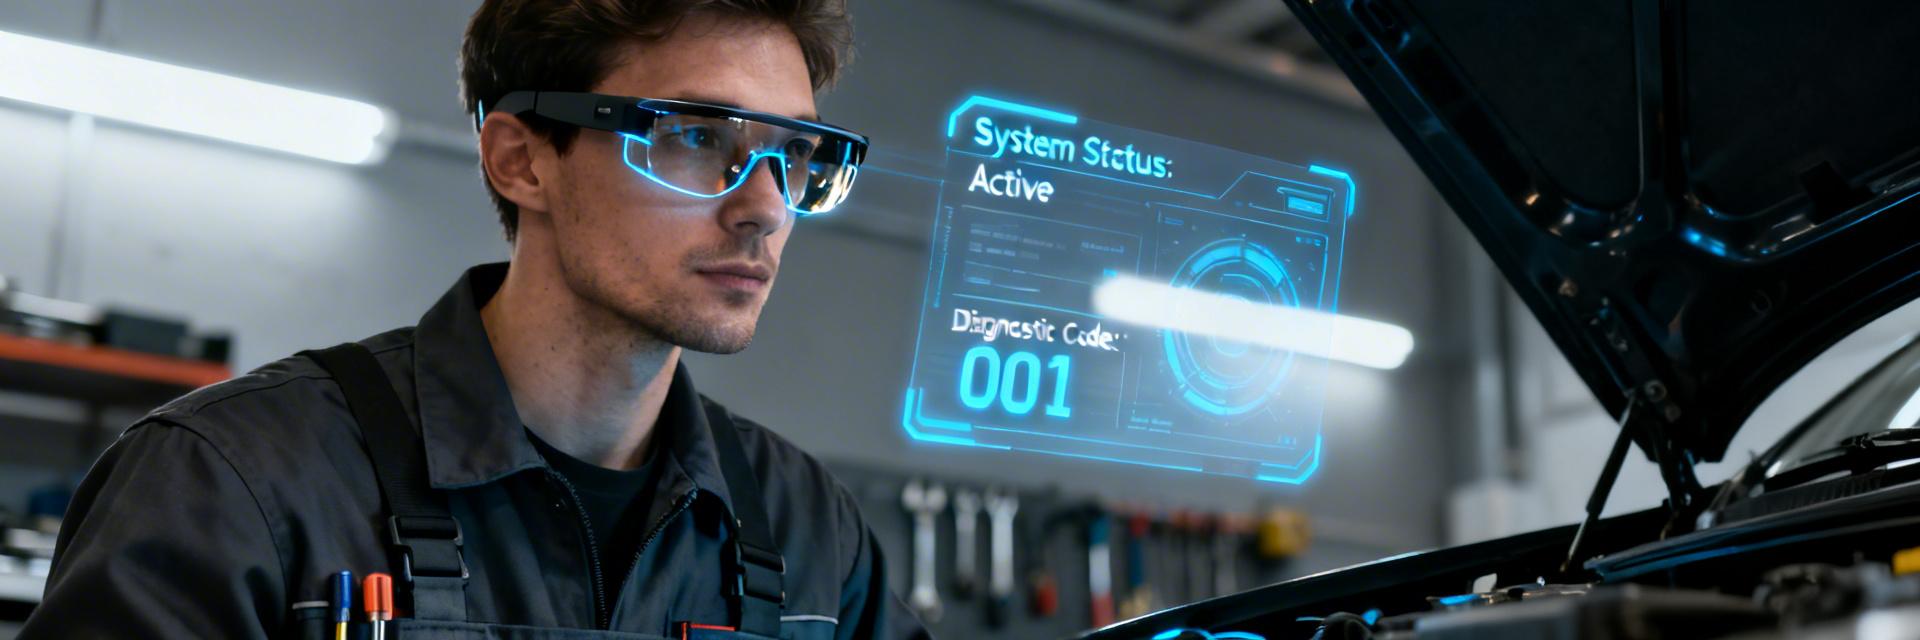
Technicians use monocular HUDs to overlay wiring diagrams. Benefit: Reduces task error rates by 30% and eliminates the need to carry physical manuals into hazardous environments.
Enterprise pilots focus on field service, industrial guidance, and medical workflows where time‑to‑value and TCO improvements are measurable. Consumer uptake depends on price, fashion, and battery life.
| Step | Success Metric | Suggested Timeline |
|---|---|---|
| 1. Define target use case | Clear KPIs | 2–4 weeks |
| 2. Set UX targets | Weight ≤ 50g | 2–6 weeks |
| 3. Choose display tech | FOV / Brightness | 4–12 weeks |
| 4. Estimate BOM & margins | Retail margin defined | 2–4 weeks |
| 5. Supplier qualification | Secondary source ID'd | 12–18 months |
| 6. Prototype for DFMA | Assembly score | 3–6 months |
| 7. Pilot at volume N | Yield rate > 90% | 1–3 months |
| 8. Refine cost roadmap | Quarterly reductions | Quarterly |
Smart glasses hardware costs are dominated by optics and display systems, followed by SoC/mainboard and power subsystems. Scale and supplier strategy are the primary levers for reducing per‑unit cost, with break‑even often tied to when display costs decline meaningfully. The highest‑impact actions for OEMs are to prioritize the optics/display roadmap, design for integration to lower BOM, and run targeted enterprise pilots to establish adoption metrics and supplier leverage.
What are the essential smart glasses hardware components to budget first?
Budget priority should follow cost and UX impact: optics/display first (tooling and coatings), then SoC/mainboard and power subsystem, followed by sensors and cameras.
How does volume affect smart glasses components pricing?
Volume drives down component ASPs and improves yields; teams should build sensitivity scenarios (e.g., 10M vs 100M units) to forecast 10–30% cost declines.


{{ boxName }} ({{ dataList?.length || 0 }} Items)
{{ val.manufacturer || val.en_manufacturer || '' }}
auto.lang_Quantity: {{ val.quantity }}
auto.lang_null