
News
2026-02-12

Recent market signals show double‑digit CAGR forecasts for smart glasses and a rapid uptick in pilot deployments across enterprise and healthcare, creating urgency around supply-side readiness. Rising unit demand is already exposing uneven supplier capacity and measurable R&D gaps that threaten launch timelines and price targets. This article builds a practical, data‑driven gap map that quantifies component shortfalls, highlights R&D gaps, and delivers actionable steps for OEMs, investors, and policymakers.
The methodology below synthesizes demand scenarios, supplier KPIs, and regional concentration to produce a quarter‑by‑quarter gap matrix. It is tailored for US stakeholders who must balance speed to market with risk mitigation; examples are anonymized and pragmatic. The term smartglassesR&Dmanufacturer appears as an internal tag for supply‑chain analytics; this report uses the common market term “smart glasses” where it’s most impactful.
Demand forks across four end markets: consumer (mass wearables), enterprise (field workflow), industrial (inspection/maintenance), and healthcare (clinical decision support). Conservative, baseline, and accelerated scenarios map to low/medium/high unit forecasts; a baseline for the US mixes 1–5 million annual units across segments in an adoption wave, while accelerated scenarios assume rapid enterprise pilots scaling into tens of millions of device shipments globally.
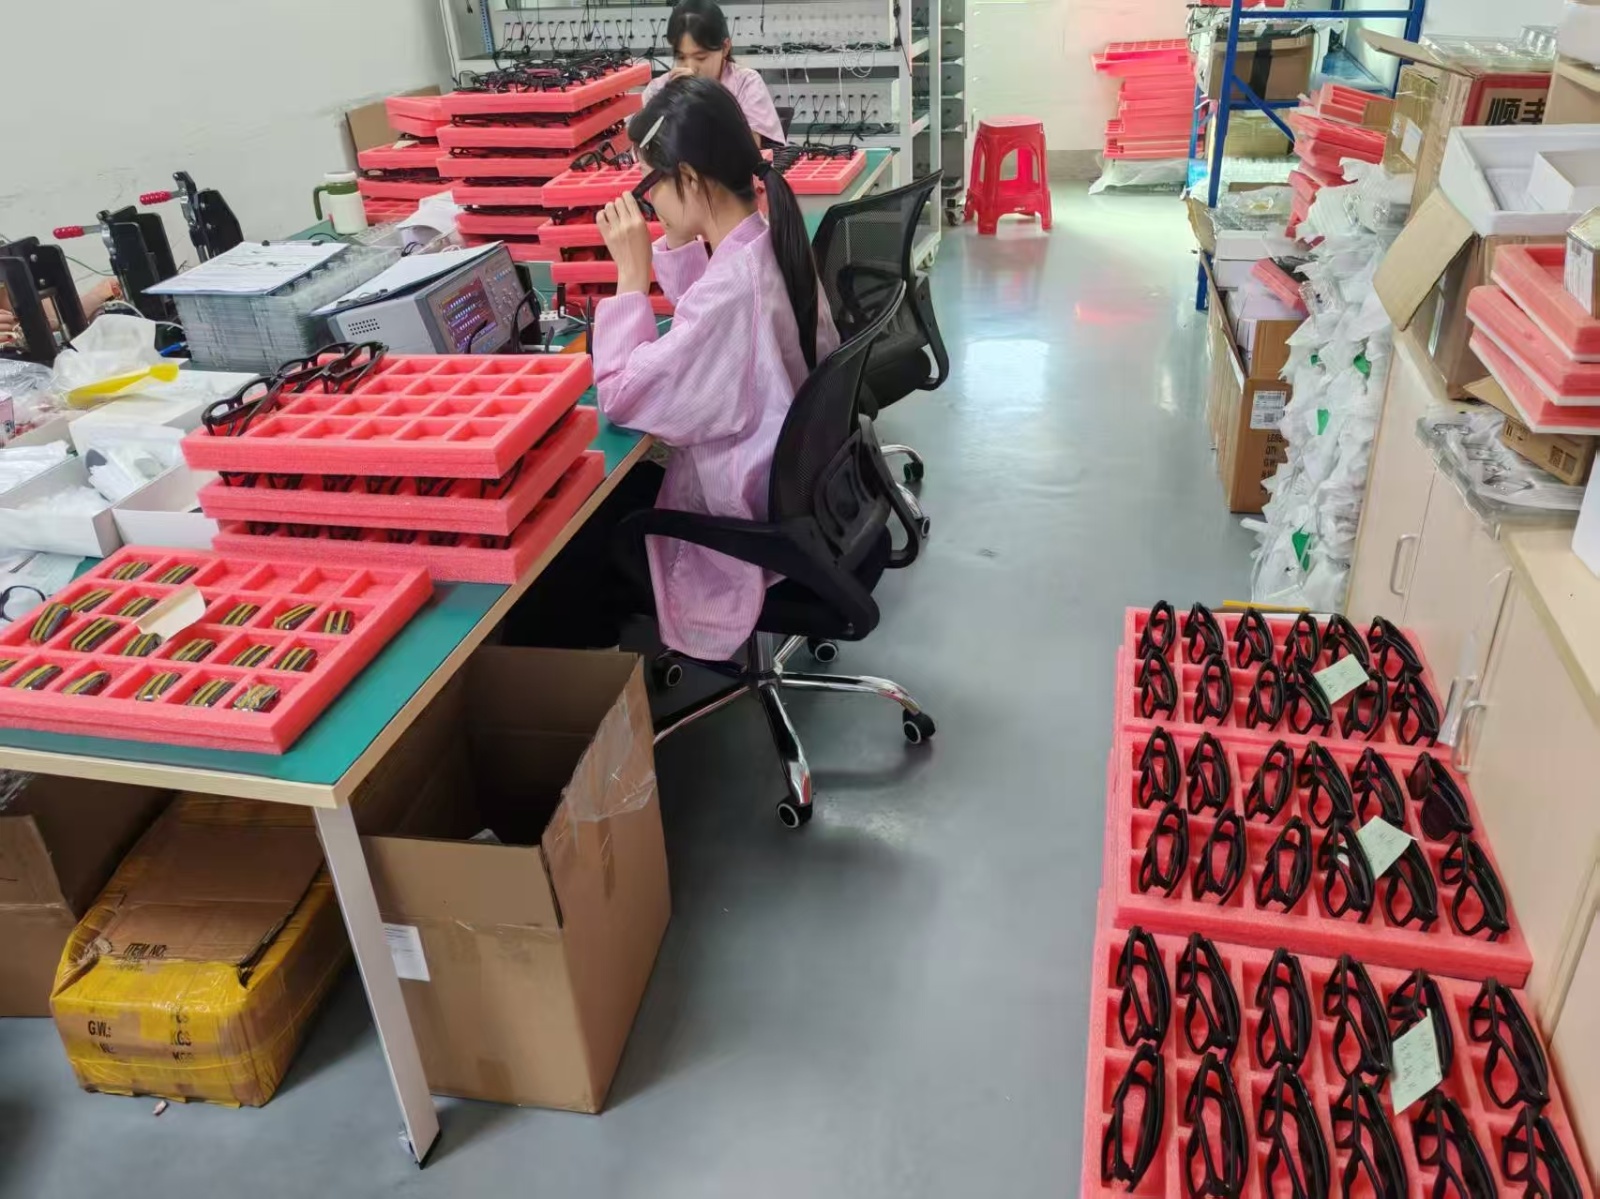
Component tiers split into strategic (microdisplays, custom SoCs/ASICs, waveguides, optics coatings, firmware/IP) and commodity (sensors, standard wireless modules, common batteries, contract assembly). Strategic tiers require deep technical partnerships and capacity commitments; commodity tiers can usually be dual‑sourced. Mapping supplier roles early clarifies who must be contracted for scale versus who can be spot‑procured.
Core KPIs: units/month, fab utilization %, available clean‑room lines, CM throughput, lead time (weeks), yield rate %, wafer starts, and backlog weeks. Normalize by converting wafers or die to finished‑unit equivalents and expressing capacity as finished units/month. Track utilization trends and capital‑intensive ramp signals (tool orders, fab line addition) to infer forward capacity.
Historically constraining items include microdisplays, precision waveguides, custom ASICs, and high‑energy density cells. Monitor wafer starts, supplier backlog weeks, tooling lead times, and qualification pipeline. Battery cell allocations and specialty optics coatings often show long lead times; early purchase commitments and OTD metrics signal whether suppliers can meet surge demand.
"When scaling smart glasses, the most common 'silent killer' isn't the display—it's the thermal management of the custom ASIC within the tight frame constraints. I recommend engineers focus on decoupling the heat sink from the skin-contact points early in the PCB layout phase."
Step 1: ingest scenario demand per quarter. Step 2: aggregate supplier finished‑unit capacity per quarter after yield adjustments. Step 3: compute headroom % = (capacity − demand)/demand. Include ramp timelines and sensitivity tables showing how 5–10% yield gains shift headroom. Output: heatmap of shortages and a gap waterfall by component.
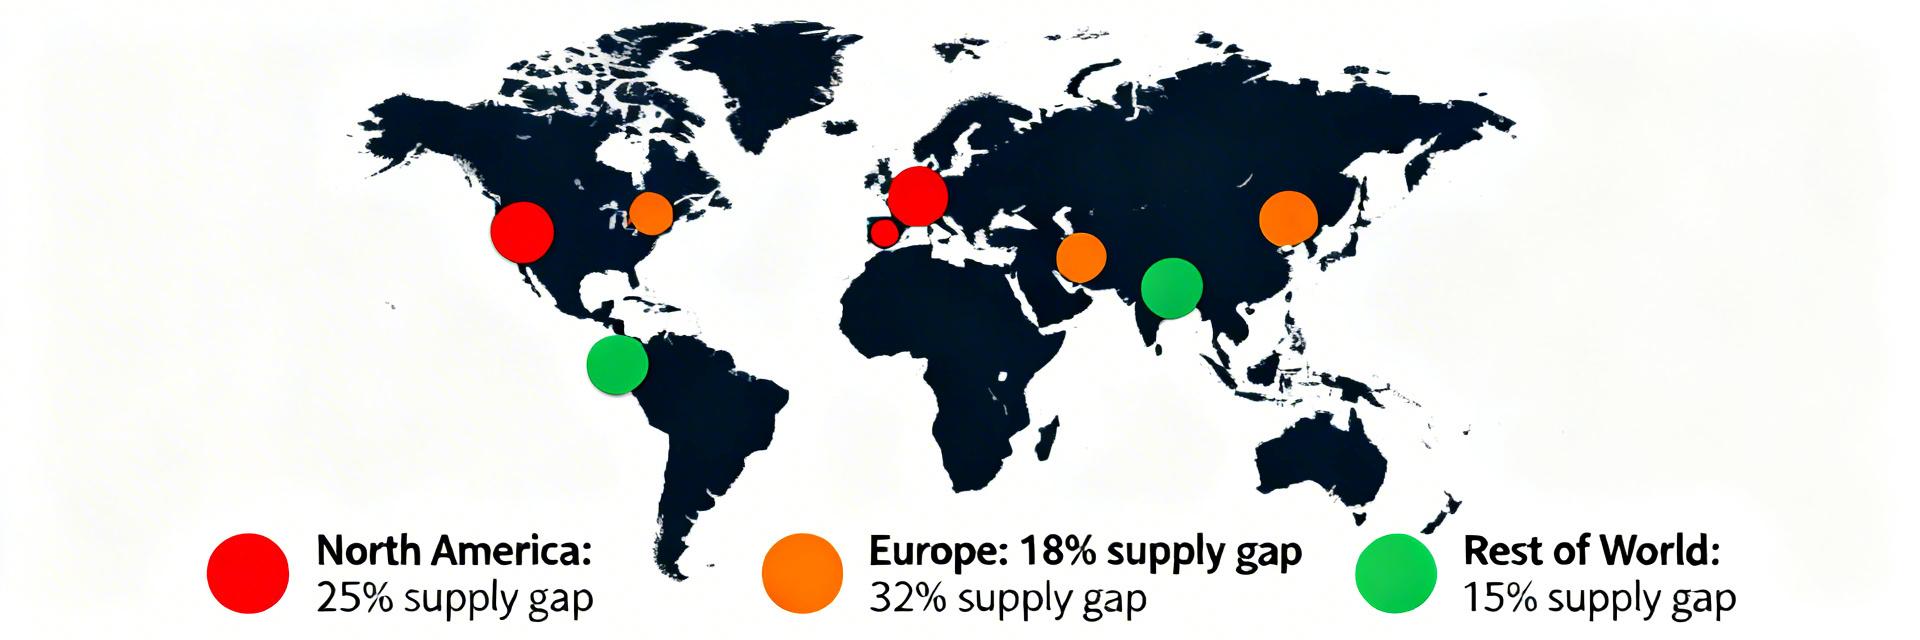
Layer supplier locations, single‑source nodes, and transit chokepoints onto the matrix. Identify hotspots where >60% capacity is regionally concentrated or where single suppliers account for >50% of a component. These hotspots raise lead‑time risk and should be prioritized for dual‑sourcing, buffer stock, or regional investment.
Hand-drawn schematic, non-precise circuit diagram
Use trade shipment data, foundry utilization updates, CM briefings, patent activity, job postings, and procurement confirmations. Core KPIs: units/month, yield, backlog, lead time, capex announcements. Validation checkpoints: supplier interviews, observed tooling deliveries, and CM acceptance tests. Job postings and patent filings act as proxies for near‑term R&D capacity and talent availability.
Pipeline: ingest disparate feeds → normalize to finished units → model scenarios → compute headroom and risk scores → visualize. Use a capacity heatmap (component × quarter), gap waterfall (demand vs. capacity drivers), and supplier risk quadrant (impact vs. likelihood). Export dashboards for quarterly updates and stakeholder review.
Immediate actions: implement prioritized risk log, enact dual‑sourcing for strategic components, calculate buffer inventory using lead‑time × consumption, and negotiate capacity reservation clauses. KPIs: fill rate, days‑of‑supply, backlog reduction, and supplier OTD. Use short engagements with pilot CMs to relieve near‑term bottlenecks.
Invest in pilot lines, co‑development with foundries, workforce programs, and standards activities. Model ROI by projecting incremental units enabled, margin improvement, and time‑to‑capacity (months to qualified volume). Prioritize initiatives with the shortest payback that also reduce single‑source dependencies. Use staged funding to de‑risk capital deployment.
Start with wafer starts and die‑to‑unit conversion, then adjust for yield and integration losses to derive finished units/month. Combine foundry utilization reports and tooling delivery notices to estimate realistic quarterly capacity.
Fastest levers include capacity reservation clauses, prepayment for tooling slots, and establishing a strategic buffer inventory calculated as (lead-time × monthly consumption).
Investors should score opportunities by pilot throughput, talent depth, and IP position. Use staged milestones (prototype → pilot → qual → volume) to model time‑to‑capacity and ROI accurately.


{{ boxName }} ({{ dataList?.length || 0 }} Items)
{{ val.manufacturer || val.en_manufacturer || '' }}
auto.lang_Quantity: {{ val.quantity }}
auto.lang_null